Sunday, March 30, 2014

Investment Idea Sharing March 30, 2014

This Week's Activity – March 29, 2014: 
Two weeks ago, on March 13, China National Offshore Oil Company (CEO) dropped to $147.24 due to a possible bribery scandal in their dealings with the Chinese government. 

CEO has been showing up on several of my stock screeners for the past few weeks.  I have been trying to decide if I should take a chance on this Chinese oil company.  Here is a link to the StockEvaluator.xls spreadsheet with a ‘Row–by-Row’ Comparison of CEO and several other large oil companies from around the world sorted by Red cell count.  CEO looks the best and also pays a 3.8% dividend.  http://www.ultimatestockfinder.com/stockevaluator_ceo_comparison.xls

Yahoo Finance Key Statistics for CEO:
I will place a Limit order for CEO on Monday 3/31/2014 at $149/share.  

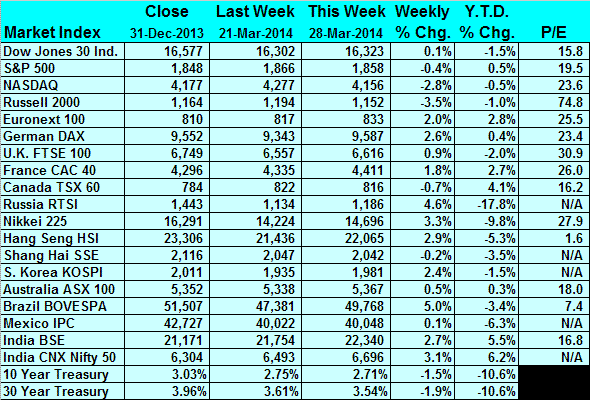
This week, the world market indices were mixed, some up a little, some down a little, but mostly flat.  Read more here: http://finance.yahoo.com/news/wall-st-week-ahead-u-212331905.html

Summary Table of Worldwide Market Index Closing values for this week:

I still think the markets are overpriced but I continue to look for good values on individual stocks of good solid companies. 

This week I found a website (http://www.insiderinsights.com/free/ ) that provides a free list of the weekly top 20 Insider Buys and Sells by dollar volume for stocks traded on US markets.
I have added their link to the Ultimate Stock Finder.com “Links” page at Table of Contents Section “1. Current Stock Market Values & Metrics” http://www.ultimatestockfinder.com/websearchlinksindex.html#today

At the right hand side of the “InsiderInsights Free Stuff” page, select either “Buys” or “Sells” and then click “Get top 20”.  The new window shows an excellent table containing:
Filer Name and  Title; Company Name and Ticker Symbol; Transaction Type and $ Value.
I will be checking these Top 20 Buy and Sell reports weekly to keep track of what the insiders are doing, and see what stocks I should be researching. 

StockEvaluator ‘Short List’
‘Short List’ screens using 12 fundamental value limits that I want to see in a stock before considering it as a possible buy. 
View our training video that shows how to enter your preferred values for each of these ‘Short List’ screening limits:

View the ‘Short List’ screening criteria and target limit values here: http://www.ultimatestockfinder.com/short_list_12_criteria.JPG

Stocks on the ‘Short List’ list this week are: CAJ, CHL, DCM

When StockEvaluator.xls was not working for the past few weeks, I had to use the FinViz stock screener.  It is excellent, so I am continuing to use it along with my ‘Short List’ as a parallel check to find good fundamental stocks that are near their 52 Week Lows.  Here is the FinViz stock screener link set to the 9 of 12 ‘Short List’ limits that are available at FinViz.  

Due to continued problems with our Mutual Fund web look-up functions, we still cannot update the data in Mutual Fund Evaluator.xls.  We are working to fix this problem and hope to have a fix in place soon.  Stock Evaluator.xls is now working properly and is available for download from our website.
 
Next Monthly Meeting 2nd Tuesday of Each Month:
Tuesday, April 8, 2014, 7:30 PM at my house. 

Here are my Stock BUYs for This Week:
Stock Symbol:
Buy Date: 
Buy Price:  
Target Sell Price:

Here are my Stock SELLs for This Week:
Stock Symbol:
Sell Date:
Sell Price:
Buy Price:
Buy Date:

Here are my Mutual Fund BUYs for This Week:
Fund Symbol:
Buy Date: 
Buy Price: 
Target Sell Price:

Here are my Option (CALL or PUT) Sells/Buys for This Week:
Option:
Stock Symbol:
Sell to Open Date:
Expiration Date:
Strike Price:
Option Price:

Visit www.ultimatestockfinder.com to download our Stock Evaluator and Mutual Fund Evaluator spreadsheets, read training articles and check out all our web links for investing information.

Please remember to send me any other investing ideas, information or questions that you want to share with the group.

Thanks,
John D.

Disclosure: The author has no positions in any of the stocks or mutual funds mentioned in this article unless clearly stated above. We certify that except as cited herein, this is our work product. We received no compensation or other inducement from any party to produce this article.  Please see our full legal disclaimer at:  http://www.ultimatestockfinder.com/stockevaluator_disclaimer.html
______________________________________________

To Remove Your Name from this email distribution list, reply to me and I will delete your name.

Ultimate Stock Finder is also on Facebook, you can ‘Like’ us on FB and receive our weekly ‘Investment Idea Sharing’ letter (summary paragraph only) to your FB page.  https://www.facebook.com/UltimateStockFinder


You can read our weekly ‘Investment Idea Sharing’ letter at our Ultimate Stock Finder blog:  http://ultimatestockfinder.blogspot.com/
Friday, March 21, 2014

Investment Idea Sharing March 22, 2014

This Week's Activity – March 22, 2014: 
On Wednesday, I bought China Mobile (CHL).  For the past several weeks, It has been on the Stock Evaluator ‘Short List’ along with the two other big Chinese phone companies (CHA, CHU).  I bought CHL at $44.50 which was a new 3 year low.  Then on Thursday CHL dropped a 3% due to reporting lower earnings.  Friday was another 3% drop.  It is now at $41.55.  If it goes to $40, I will buy more.  Current dividend is 4.3%

Here is an article from last week discussing the new Value Added Tax that China will be imposing on their phone companies.

Here is the article explaining Thursday’s price drop for CHL.

Another article explaining the big picture on Telecom in China.

This week, the world market indices were flat. 

I still think the markets are overpriced but I continue to look for good values on individual stocks of good solid companies. 

Two vary famous long term value investors are Warren Buffett (Berkshire Hathaway BRK-A) and Carl Icahn (Icahn Enterprises IEP).  They have very different approaches to how they get along with the companies they buy into.  Buffett likes to have a friendly advice giving role while working with the CEO and board of directors, while Icahn prefers a more adversarial approach and often forces elections to gain him seats for his friends on the board of directors of many companies to force sweeping changes including sometimes a new CEO.

Both men also have a different approach to how they handle the debt for their two companies.

Icahn (IEP) has so much Debt to Equity and Goodwill to Equity that his company has negative Net Tangible assets of -$3 Billion on Revenues of $21 Billion, while at the same time paying a 5.7% dividend.  Icahn is playing fast and loose with other peoples money.

Compare with Buffett (BRK-A) Goodwill to Equity of 30% and Debt to Equity of 107% which leads to a Net Tangible Assets of $164 Billion on Revenues of $182 Billion, but pays out no dividend.  Buffett is reinvesting his own money in his company.

Yahoo Finance Key Statistics and Balance Sheets for:


Summary Table of Worldwide Market Index Closing values for this week:

Due to continued problems with our Stock Market web look-up functions, we still cannot update the data in Stock Evaluator.xls and Mutual Fund Evaluator.xls.  We are working to fix this problem and hope to have a fix in place soon.

In the mean time, I have been trying other web stock screeners and I really like the one by FinViz.  It allows me to enter most of the same criteria and limits that I use to make the Stock Evaluator ‘Short List’.  FinViz provides several different screen views of key types of values for the stocks that meet your screen criteria limits (Valuation, Financial, Performance, Technical, etc.) 
The screen view I like best is the ‘Custom’ screen that lets me select the exact data fields I want to see when FinViz displays the stocks that meet my criteria limits. 
Click ‘Settings’ at the upper right of the table if you want to change which fields are displayed in this ‘Custom’ view.
Click ‘Filters’ if you want to change any of my criteria screening limits.


FinViz does not provide the ‘Row-by-Row’ comparison capability that we have in StockEvaluator spreadsheet.  FinViz also does not provide the ‘Goodwill to Equity’ value.
 
Next Monthly Meeting 2nd Tuesday of Each Month:
Tuesday, April 8, 2014, 7:30 PM at my house. 

Here are my Stock BUYs for This Week:
Stock Symbol: CHL
Buy Date:  3/19/2014
Buy Price:  $44.50
Target Sell Price: $60 (hold due to good dividend of 4.4%)

Stock Symbol: EZPW
Buy Date:  3/21/2014
Buy Price:  $12.50
(This was due to a PUT Option I sold in November 2013 for $1.30 at Strike of $12.50. 
  On 3/21/2014, EZPW was selling for $12.23, so I got it PUT to me at $12.50. 
  On Monday, I will place an order to sell a $12.50 September CALL for $2.00)
Target Sell Price: $14.50

Here are my Stock SELLs for This Week:
Stock Symbol:
Sell Date:
Sell Price:
Buy Price:
Buy Date:

Here are my Mutual Fund BUYs for This Week:
Fund Symbol:
Buy Date: 
Buy Price: 
Target Sell Price:

Here are my Option (CALL or PUT) Sells/Buys for This Week:
Option:
Stock Symbol:
Sell to Open Date:
Expiration Date:
Strike Price:
Option Price:

Visit www.ultimatestockfinder.com to download our Stock Evaluator and Mutual Fund Evaluator spreadsheets, read training articles and check out all our web links for investing information.

Please remember to send me any other investing ideas, information or questions that you want to share with the group.

Thanks,
John D.

Disclosure: The author has no positions in any of the stocks or mutual funds mentioned in this article unless clearly stated above. We certify that except as cited herein, this is our work product. We received no compensation or other inducement from any party to produce this article.  Please see our full legal disclaimer at:  http://www.ultimatestockfinder.com/stockevaluator_disclaimer.html
______________________________________________

To Remove Your Name from this email distribution list, reply to me and I will delete your name.

Ultimate Stock Finder is also on Facebook, you can ‘Like’ us on FB and receive our weekly ‘Investment Idea Sharing’ letter (summary paragraph only) to your FB page.  https://www.facebook.com/UltimateStockFinder


You can read our weekly ‘Investment Idea Sharing’ letter at our Ultimate Stock Finder blog:  http://ultimatestockfinder.blogspot.com/

Friday, March 14, 2014

Investment Idea Sharing March 15, 2014

This Week's Activity – March 15, 2014: 
My wife and I are 59, and the next big decision we will have to make in retirement is when to start drawing our Social Security.  This is an extremely important decision because of the huge 76% increase in the annual payment if you wait to start until age 70 versus starting to take Social Security payments at age 62.  We view this 76% increase as our ‘Long Term Care’ insurance because it will be there to help us as we get too old to make good investing decisions.  At some point, we will have to transition to relying completely on our investment dividends and income because we will not be able to do the research needed to make those good stock trades that earn capital gains for additional income as we do now.  


In last week’s Investment Idea Sharing newsletter I had a link to my ‘Investment Tracker’ spreadsheet that can contain all of your holdings, calculate your total net worth and show the ratios of everything in your portfolio.  Two of our Investment Idea Sharing group, John Q. and Bonnie B., tried it and found the re-calculation was not working properly.  This was because I had turned off the Automatic Recalculation function because the Stock Market Look-Up Functions take so long to refresh that it becomes a waiting game while the spreadsheet tries to re-calculate after each cell when you are entering new data. 

I have now added an ‘Instructions’ worksheet in front of the ‘Investment Tracker’ worksheet to explain how to turn the Automatic Recalculation function On and Off. 
In Excel 2003, click ‘Tools’ – ‘Options’ – ‘Calculation’ and select either ‘Automatic’ or ‘Manual’.  When in the ‘Automatic’ mode, the spreadsheet will automatically look up current price for each stock, but will also try to do this repeatedly as you move from cell to cell entering new data.  When in the ‘Manual’ mode, the spreadsheet does NOT try to re-calculate during data entry, and when you are done entering data, you can always force a re-calculation by hitting the F-9 key. 

Here is the link to download a fully functional version of my ‘Investment Tracker Example’ spreadsheet that you can personalize with your holdings:  http://www.ultimatestockfinder.com/investment_tracker_example.xls
It is also available from the ‘Training’ page at Ultimate Stock Finder.com: 

This week, most of the world market indices were down about 3% due to worries about what Russia will do in Ukraine and Crimea.  The Russian RTSI stock market index was down 8%.
Next week may have more down action if Russia decides to make a bold move.

I still think the markets are overpriced but I continue to look for good values on individual stocks of good solid companies. 

Summary Table of Worldwide Market Index Closing values for this week:

Due to continued problems with our Stock Market web look-up functions, we still cannot update the data in Stock Evaluator.xls and Mutual Fund Evaluator.xls.  We are working to fix this problem and hope to have a fix in place soon.

In the mean time, I have been trying other web stock screeners and I really like the one by FinViz.  It allows me to enter most of the same criteria and limits that I use to make the Stock Evaluator ‘Short List’.  FinViz provides several different screen views of key types of values for the stocks that meet your screen criteria limits (Valuation, Financial, Performance, Technical, etc.) 
The screen view I like best is the ‘Custom’ screen that lets me select the exact data fields I want to see when FinViz displays the stocks that meet my criteria limits. 
Click ‘Settings’ at the upper right of the table if you want to change which fields are displayed in this ‘Custom’ view.
Click ‘Filters’ if you want to change any of my criteria screening limits.

   
FinViz does not provide the ‘Row-by-Row’ comparison capability that we have in StockEvaluator spreadsheet.  FinViz also does not provide the ‘Goodwill to Equity’ value.
 
Next Monthly Meeting 2nd Tuesday of Each Month:
Tuesday, April 8, 2014, 7:30 PM at my house. 

Here are my Stock BUYs for This Week:
Stock Symbol:
Buy Date: 
Buy Price:  
Target Sell Price:

Here are my Stock SELLs for This Week:
Stock Symbol:
Sell Date:
Sell Price:
Buy Price:
Buy Date:

Here are my Mutual Fund BUYs for This Week:
Fund Symbol:
Buy Date: 
Buy Price: 
Target Sell Price:

Here are my Option (CALL or PUT) Sells/Buys for This Week:
Option:  PUT
Stock Symbol: PBR
Sell to Open Date:  March 14, 2014
Expiration Date: Oct. 18, 2014
Strike Price: $10
Option Price: $1.15

Visit www.ultimatestockfinder.com to download our Stock Evaluator and Mutual Fund Evaluator spreadsheets, read training articles and check out all our web links for investing information.

Please remember to send me any other investing ideas, information or questions that you want to share with the group.

Thanks,
John D.

Disclosure: The author has no positions in any of the stocks or mutual funds mentioned in this article unless clearly stated above. We certify that except as cited herein, this is our work product. We received no compensation or other inducement from any party to produce this article.  Please see our full legal disclaimer at:  http://www.ultimatestockfinder.com/stockevaluator_disclaimer.html
______________________________________________

To Remove Your Name from this email distribution list, reply to me and I will delete your name.

Ultimate Stock Finder is also on Facebook, you can ‘Like’ us on FB and receive our weekly ‘Investment Idea Sharing’ letter (summary paragraph only) to your FB page.  https://www.facebook.com/UltimateStockFinder


You can read our weekly ‘Investment Idea Sharing’ letter at our Ultimate Stock Finder blog:  http://ultimatestockfinder.blogspot.com/

Friday, March 7, 2014

Investment Idea Sharing March 7, 2014

This Week's Activity – March 8, 2014: 
Remember, this month’s meeting is Tuesday, March 11, 2014, 7:30 PM at my house. 

My favorite CEO is Herb Kelleher, founder and retired CEO of Southwest airlines.
Herb has an approach to management of business and employees that is very simple and effective, yet none of his other competitors have chosen to follow it even though he started his successful airline in 1973.  Here is an excellent interview he gave to ‘Fortune’ ,magazine in Jan. 2013.  http://management.fortune.cnn.com/2013/01/14/kelleher-southwest-airlines/

Two of my investing friends, Michael and Nathan, have been immensely helpful with improving my Evaluator spreadsheets over the past 3 years.  One of the key functions they introduced me to is an automatic web lookup function for Excel that returns current price/share for any stock or mutual fund symbol.  This look up function is called ‘EXCEL Stock Market Functions Add-In’.  Read about it here: https://groups.yahoo.com/neo/groups/smf_addin/info

I am using this ‘SMF’ function in my personal ‘Investment Tracker’ spreadsheet that contains all of my holdings.  This function allows my spreadsheet to show a real time value of my net worth, so I do NOT have to enter all of my holdings into one of those web sites with a ‘Cloud’ based table where you enter in all of your holdings.  I DO NOT want all my holdings on the web in one place for others to see what and how much I hold. 
My spreadsheet also calculates several key metrics including:
   Total holdings value ; % Gain for each holding ; % of portfolio for each holding

You can download a fully functional example version of my ‘Investment Tracker’ spreadsheet for your own use from the ‘Training’ page at Ultimate Stock Finder.com:  http://www.ultimatestockfinder.com/investmenttrainingindex.html

This week, the world market indices were mixed, some up, some down, but none by much.

I still think the markets are overpriced but I continue to look for good values on individual stocks of good solid companies. 

Summary Table of Worldwide Market Index Closing values for this week:

StockEvaluator ‘Short List’
‘Short List’ screens using 12 fundamental value limits that I want to see in a stock before considering it as a possible buy. 
View our training video that shows how to enter your preferred values for each of these ‘Short List’ screening limits:

View the ‘Short List’ screening criteria and target limit values here: http://www.ultimatestockfinder.com/short_list_12_criteria.JPG

Stocks on the ‘Short List’ list this week are:  Short List would not run this week due to web look up problems.

Stock Evaluator ‘Volatility Sort’
Stocks on the ‘Volatility Sort’ have Current Price <5% above 52 week low, Volatility >1%, Profit>0%, <5 Red cells, Debt-to-Equity<80%, Goodwill-to-Equity<50%. 
Stocks on the ‘Volatility Sort’ this week are: Volatility Sort would not run this week due to web look up problems.

MutualFundEvaluator ‘Short List’
Mutual Funds that are within 3% of their 52 week low AND have less than 3 Red cells. 
This week’s list has 34 funds.  All are Bond funds, which are all still 5 to 9% above their lows from 2006 to 2008 before The FED dropped interest rates to bring the U.S. out of the recession.  When interest rates go down, bond prices go up, and when interest rates go up, bond prices go down.  These bond funds only pay a 3 to 4% annual dividend and I think the bond prices will go down another 3 to 4% when The FED finally lets interest rates go back to historic levels which mean 10 Year Bond interest rate of at least 3.5% compared to today’s 10 year rate of 2.79%.  Mutual Fund Evaluator ‘Short List’ would not run this week due to web look up problems.

Next Monthly Meeting 2nd Tuesday of every Month:
Tuesday, March 11, 2014 , 7:30 PM at my house. 

Here are my Stock BUYs for This Week:
Stock Symbol:
Buy Date: 
Buy Price:  
Target Sell Price:

Here are my Stock SELLs for This Week:
Stock Symbol:
Sell Date:
Sell Price:
Buy Price:
Buy Date:

Here are my Mutual Fund BUYs for This Week:
Fund Symbol:
Buy Date: 
Buy Price: 
Target Sell Price:

Here are my Option (CALL or PUT) Sells/Buys for This Week:
Option:  
Stock Symbol:
Buy to Close Date:
Expiration Date:
Strike Price:
Option Price:

Visit www.ultimatestockfinder.com to download all Stock Evaluator and Mutual Fund Evaluator spreadsheets, read training articles and check out all our web links for investing information.

Please remember to send me any other investing ideas, information or questions that you want to share with the group.

Thanks,
John D.

Disclosure: The author has no positions in any of the stocks or mutual funds mentioned in this article unless clearly stated above. We certify that except as cited herein, this is our work product. We received no compensation or other inducement from any party to produce this article.  Please see our full legal disclaimer at:  http://www.ultimatestockfinder.com/stockevaluator_disclaimer.html
______________________________________________

To Remove Your Name from this email distribution list, reply to me and I will delete your name.

Ultimate Stock Finder is also on Facebook, you can ‘Like’ us on FB and receive our weekly ‘Investment Idea Sharing’ letter (summary paragraph only) to your FB page.  https://www.facebook.com/UltimateStockFinder


You can read our weekly ‘Investment Idea Sharing’ letter at our Ultimate Stock Finder blog:  http://ultimatestockfinder.blogspot.com/

Sunday, March 2, 2014

Investment Idea Sharing March 1, 2014

This Week's Activity – March 1, 2014: 
This week, the world market indices were mixed, some up, some down, but none by much.

I still think the markets are overpriced but continue to look for good values on individual stocks of fundamentally valuable companies. 

Two manufacturers of RF integrated circuits that go into cell phones, RFMD and TriQuint, announced on Tuesday that they will merge in late 2014. http://finance.yahoo.com/news/triquint-rfmd-merger-equals-205504969.html

My wife and I work as a team in managing our retirement investments, researching and discussing stock and mutual fund choices before placing an order.  Sometimes we don’t agree, and have to do more research to get enough facts to change one of our minds.  Last week was one of those times.  My wife is tired of waiting for the Fed to raise interest rates, and she wanted to buy Vanguard Tax Free Municipal Bond VWLTX which pays a Federal tax free interest rate of 3.99%.  For the past year, I have been expecting the Fed to raise rates, which should cause prices on bond mutual funds to go down.  I expect that most bond funds will go down about 5% from today’s current prices as the Fed lets the 10 Year rate go back up to a more normal 3.5% from the current rate of 2.66%.  If that 5% share price drop happens, then this 3.99% return will be swamped out by the 5% drop in share price over the next year.  My wife believes that the Vanguard fund will not go down by that much and she wants to start receiving the nice tax free dividend.    

Here is the 10 year chart for VWLTX.  Note that VWLTX dipped to $10.80 on Sept. 2, 2013.
But, I did not buy because I was waiting for $10.50, which never happened.  My wife told me I was being too greedy, because after touching $10.80 on Sept. 2, VWLTX rocketed back up 4.5% to the $11.29 that we paid for it on Thursday.  If VWLTX turns and goes back down to my target of $10.50, we will buy more. 

Visit our website: http://www.ultimatestockfinder.com/ for more investing ideas, links, training, tools and information.

Summary Table of Worldwide Market Index Closing values for this week:

StockEvaluator ‘Short List’
‘Short List’ screens using 12 fundamental value limits that I want to see in a stock before considering it as a possible buy. 
View our training video that shows how to enter your preferred values for each of these ‘Short List’ screening limits:

View the ‘Short List’ screening criteria and target limit values here: http://www.ultimatestockfinder.com/short_list_12_criteria.JPG

Stocks on the ‘Short List’ list this week are:  Short List would not run this week due to web look up problems.

Stock Evaluator ‘Volatility Sort’
Stocks on the ‘Volatility Sort’ have Current Price <5% above 52 week low, Volatility >3%, Profit>0%, <6 Red cells in Stock Evaluator.xls. 
Stocks on the ‘Volatility Sort’ this week are: Volatility Sort would not run this week due to web look up problems.   

MutualFundEvaluator ‘Short List’
Mutual Funds that are within 3% of their 52 week low AND have less than 3 Red cells. 
Mutual Fund Short List would not run this week due to web look up problems. 
Last Week’s list had 34 funds.  All are Bond funds, which are all still 5 to 9% above their lows from 2006 to 2008 before The FED dropped interest rates to bring the U.S. out of the recession.  When interest rates go down, bond prices go up, and when interest rates go up, bond prices go down.  These bond funds only pay a 3 to 4% annual dividend and I think the bond prices will go down another 3 to 4% when The FED finally lets interest rates go back to historic levels which mean 10 Year Bond interest rate of at least 3.5% compared to today’s 10 year rate of 2.6%. 


Next Monthly Meeting 2nd Tuesday of every Month:
Tuesday, March 11, 2014 , 7:30 PM at my house. 

Here are my Stock BUYs for This Week:
Stock Symbol:
Buy Date: 
Buy Price:  
Target Sell Price:

Here are my Stock SELLs for This Week:
Stock Symbol:
Sell Date:
Sell Price:
Buy Price:
Buy Date:

Here are my Mutual Fund BUYs for This Week:
Fund Symbol: VWLTX
Buy Date:  2/27/2014
Buy Price:  $11.29
Target Sell Price: (None) Long Term Hold due to 3.99% dividend

Here are my Option (CALL or PUT) Sells/Buys for This Week:
I Bought to Close this Cash Secured PUT that I had sold on Jan. 6, 2014 at $2.35/share
Option:  
Stock Symbol:
Buy to Close Date:
Expiration Date:
Strike Price:
Option Price:

Visit www.ultimatestockfinder.com to download all Stock Evaluator and Mutual Fund Evaluator spreadsheets, read training articles and check out all our web links for investing information.

Please remember to send me any other investing ideas, information or questions that you want to share with the group.

Thanks,
John D.

Disclosure: The author has no positions in any of the stocks or mutual funds mentioned in this article unless clearly stated above. We certify that except as cited herein, this is our work product. We received no compensation or other inducement from any party to produce this article.  Please see our full legal disclaimer at:  http://www.ultimatestockfinder.com/stockevaluator_disclaimer.html
______________________________________________

To Remove Your Name from this email distribution list, reply to me and I will delete your name.

Ultimate Stock Finder is also on Facebook, you can ‘Like’ us on FB and receive our weekly ‘Investment Idea Sharing’ letter (summary paragraph only) to your FB page.  https://www.facebook.com/UltimateStockFinder


You can read our weekly ‘Investment Idea Sharing’ letter at our Ultimate Stock Finder blog:  http://ultimatestockfinder.blogspot.com/